Open Source
pgslowlog
Built by Rafael Bautista
A small command-line tool that turns a PostgreSQL slow query log into a ranked list of the queries actually worth fixing.
Builder email verified
Verification
- Type
- Personal
- Category
- Open Source
- Published
- Jul 25, 2026
- Updated
- Jul 25, 2026
About this project
- What I built & why
Every time I joined a project with a slow database, I did the same thing: pull the slow query log, normalise the literals out, group by shape, sort by total time rather than by the slowest single run. I did it with an ad-hoc shell pipeline for years and rewrote that pipeline badly maybe eight times. Eventually I got annoyed enough to write it properly as a single binary I could drop on any box. It exists because the built-in tooling answers 'what was slowest once' and the question I always have is 'where did the time actually go'.
- The problem
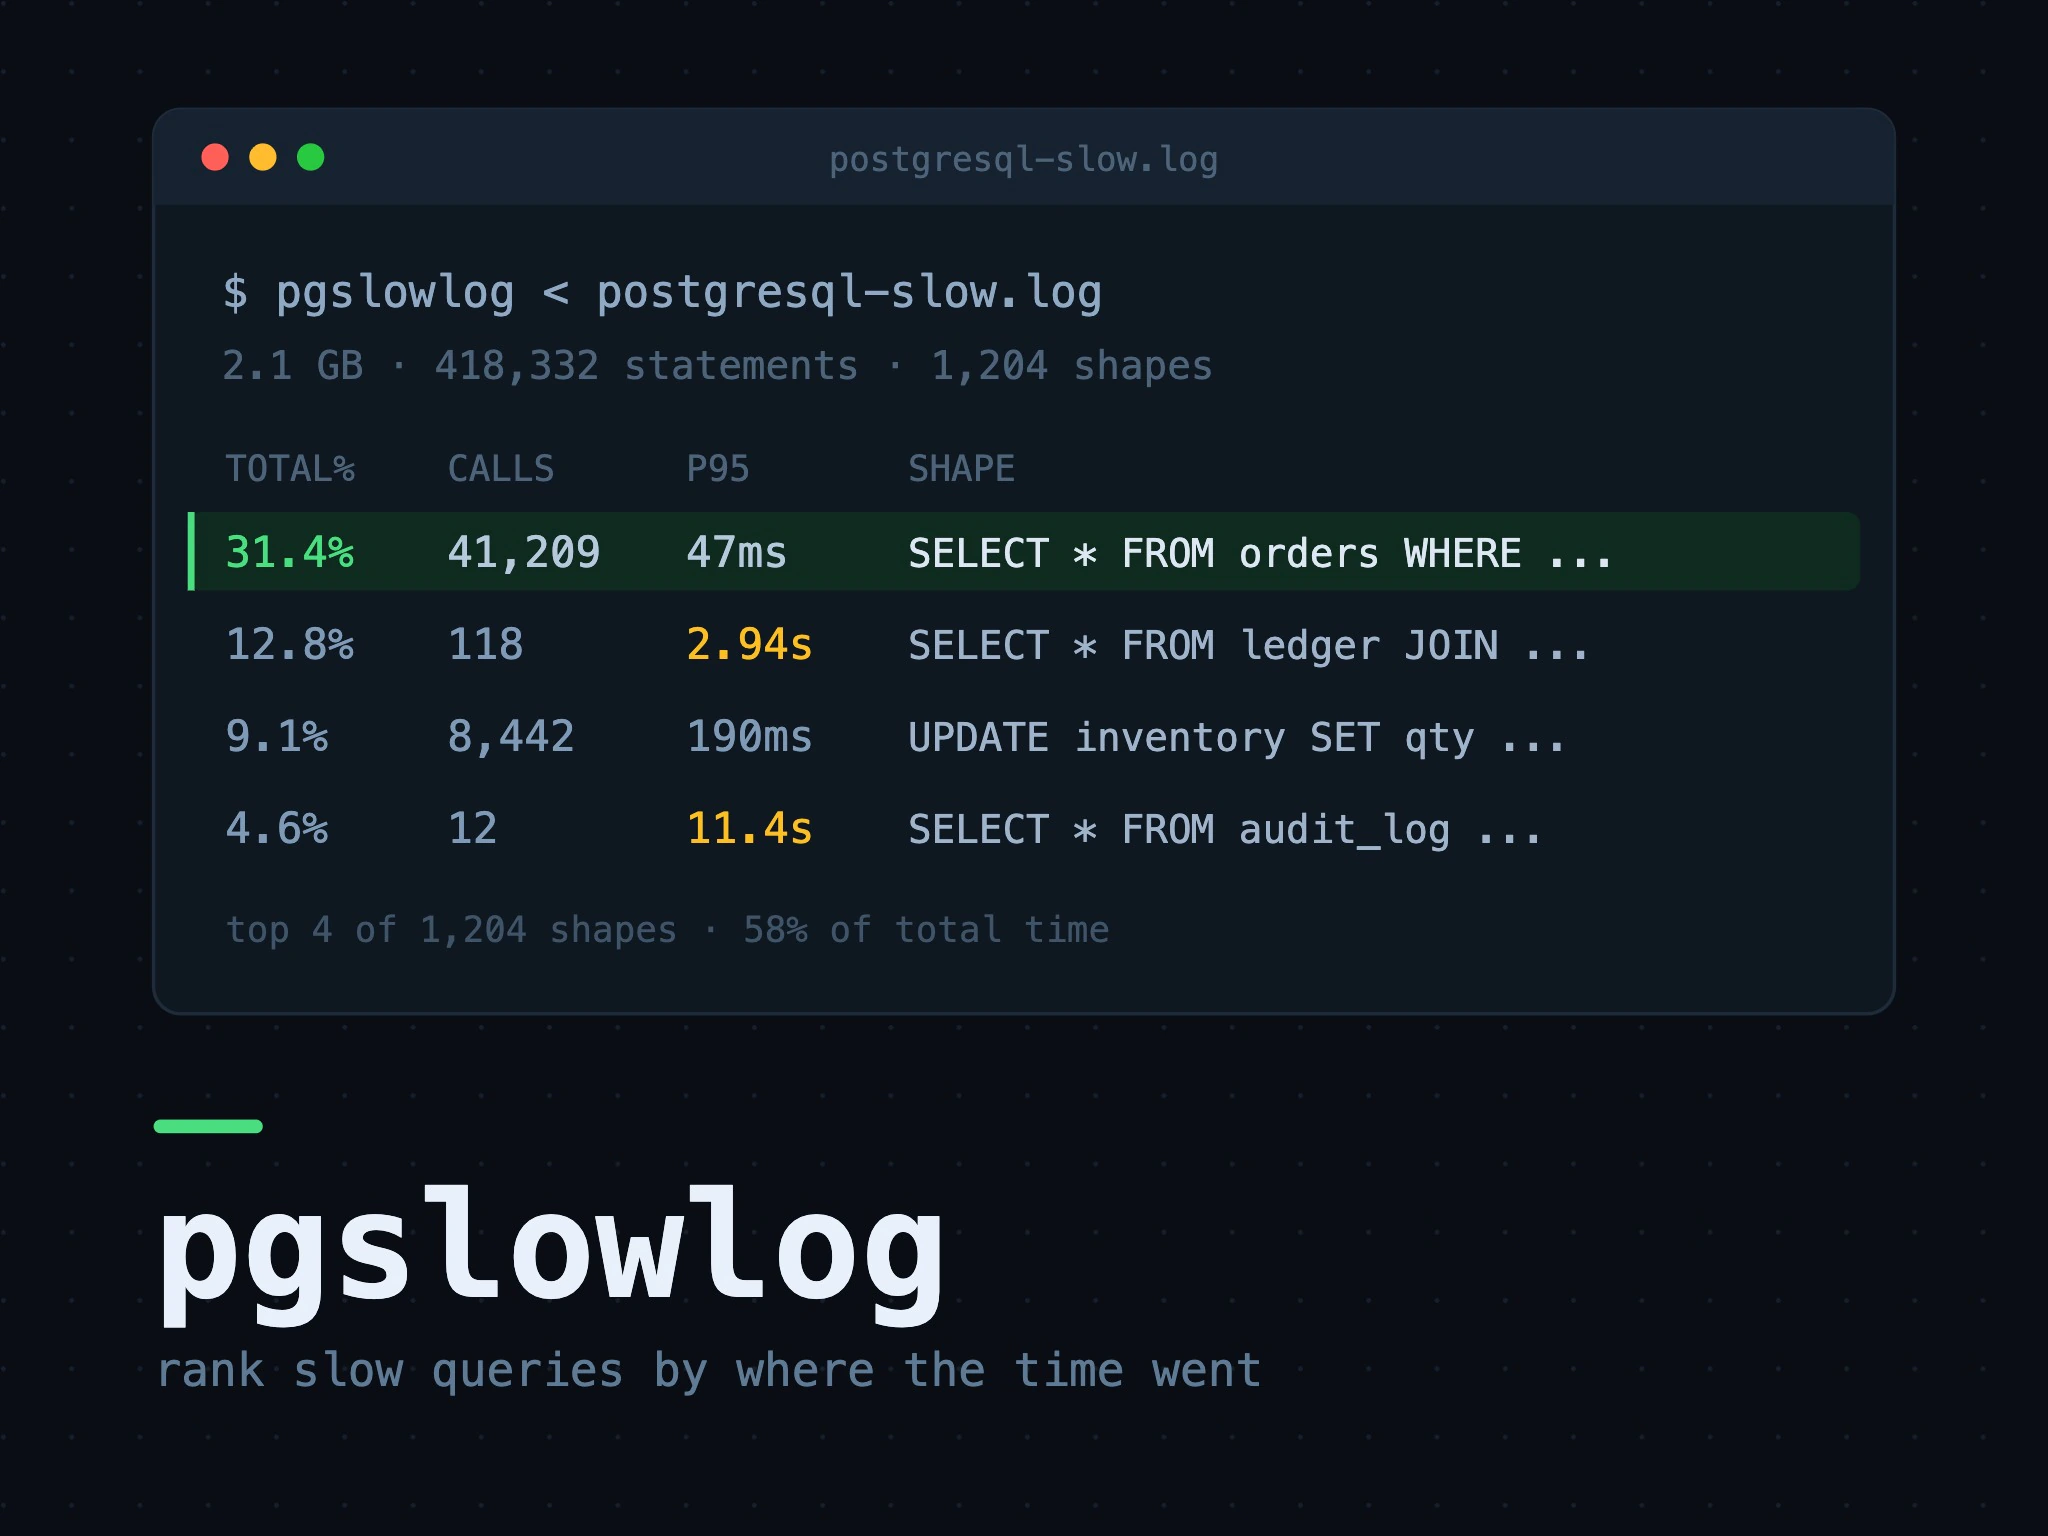
It solves a narrow problem for people who inherit a database they did not design. The slowest individual query is usually a one-off report nobody runs; the query worth fixing is the mediocre one that runs forty thousand times an hour. pgslowlog reads the log, normalises each statement to a shape, and ranks shapes by cumulative time, with counts and percentiles beside them. It is for backend engineers and accidental DBAs — people who need an answer in ten minutes, not a monitoring stack.
- What I owned
All of it — I am the only committer. The parser, the statement normaliser, the ranking, the terminal output and the CSV export are mine. The normaliser is the part with any real substance: stripping literals without destroying the shape means handling arrays, IN lists of varying length, and quoted identifiers that happen to contain semicolons. I also maintain the release builds for Linux and macOS and answer the issues, which arrive at a rate of about one a month.
- Technical & product decisions
I made it a single static binary with no configuration file, because the situations where I need it are exactly the situations where I cannot install anything. It reads from stdin by default so it composes with the tools people already use to get the log off a server. I deliberately did not add a web interface or a database of its own, which two issues have asked for — the moment it stores history it becomes something you have to run, and I wanted something you throw away. Go rather than Python was mostly about that single-binary distribution; the parsing speed was a nice accident.
- Hardest challenge
Statement normalisation is harder than it looks and I got it wrong twice. My first version used a regular expression pass, which merged genuinely different queries whenever a literal appeared inside a string, and quietly split identical ones when whitespace differed. The second version tokenised properly but was about thirty times slower, which mattered on a two-gigabyte log. What finally worked was a hand-written scanner that only understands enough SQL to know whether it is inside a string, a comment, or an identifier, and treats everything else as a byte. It is not a SQL parser and it should never become one.
- Result & impact
About nine hundred stars and a steady trickle of installs; I know of four companies using it because they told me. The feedback I liked most was from someone who found a query taking thirty-one percent of their database's total time that nobody had noticed because each run was under fifty milliseconds. On my own work it has paid for itself repeatedly — most recently it took the top three queries on a client's system from a guess to a fact inside an afternoon.
- Who else worked on it
Mostly me, but two contributors matter: one rewrote the percentile calculation to stop holding every duration in memory, and another added the CSV export and then used it to build something entirely different, which is the best outcome an unglamorous tool can have.