Open Source
Meter Logger
Built by Reymart Dalisay
A Raspberry Pi that reads my electricity meter and charts consumption, built after an unexplained bill.
Builder email verified
Verification
- Type
- Personal
- Category
- Open Source
- Published
- Jul 25, 2026
- Updated
- Jul 25, 2026
About this project
- What I built & why
Our electricity bill jumped by about forty percent one month with no explanation, and the utility's answer was that it was correct. I had no way to argue because I had no data. I bought a pulse sensor and a Raspberry Pi, clipped it to the meter, and started logging. It began as a two-evening project to settle one argument and turned into something I've been running for three years, mostly because the charts turned out to be more interesting than the dispute.
- The problem
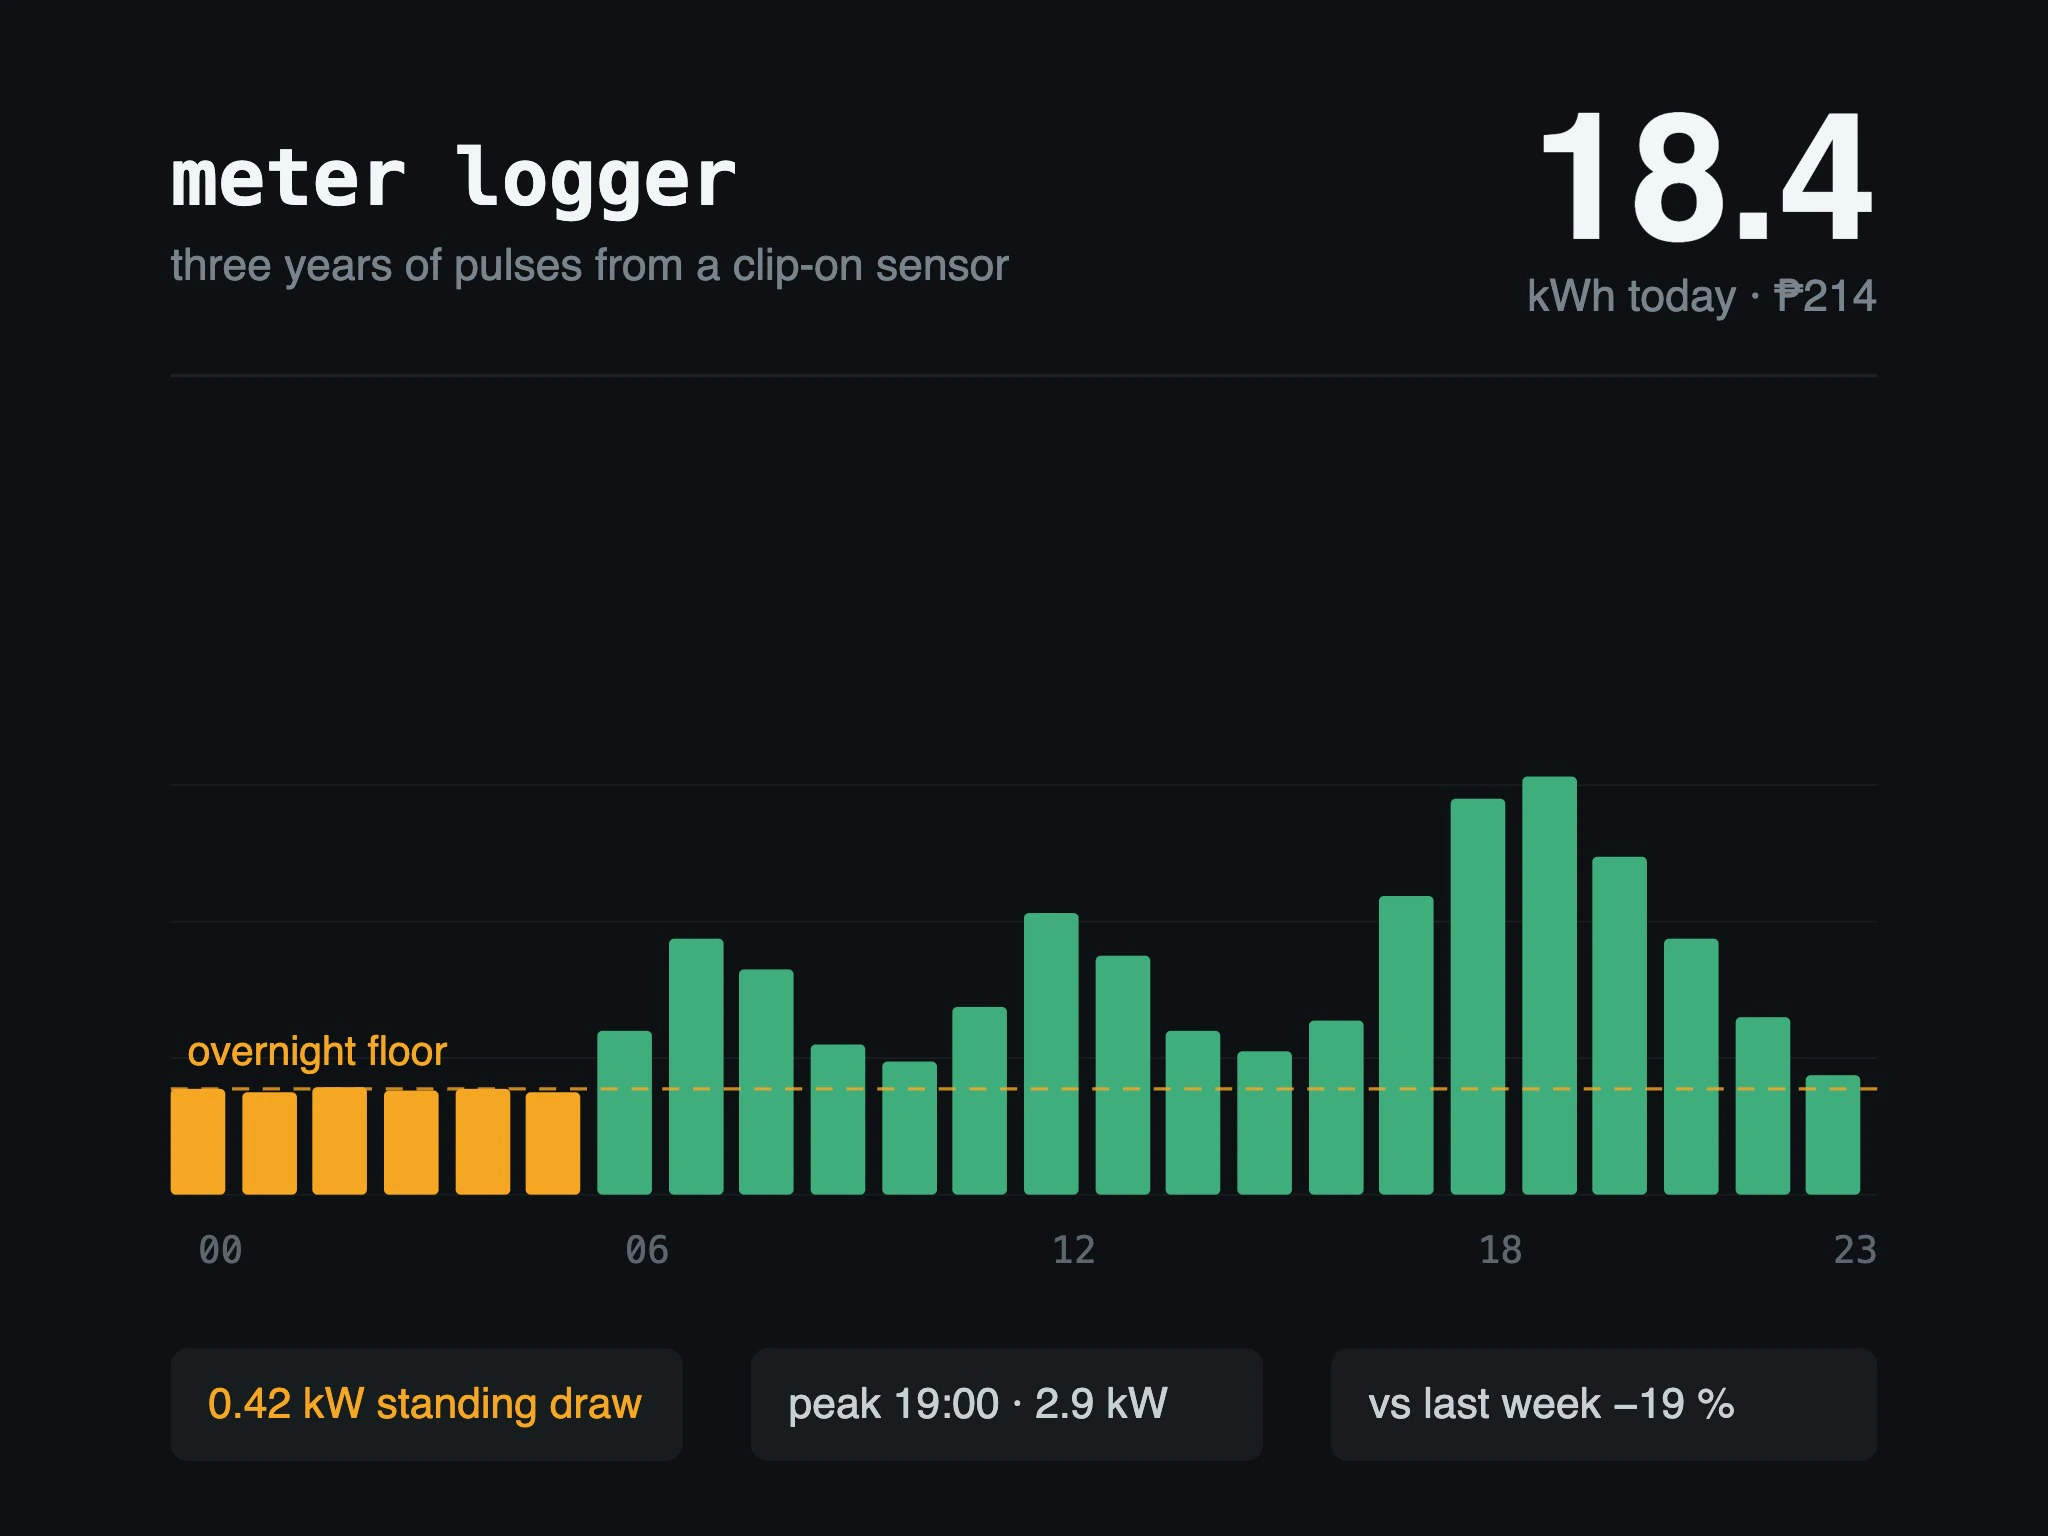
The problem is that household electricity is billed monthly and consumed continuously, so by the time you see a number it's far too late to connect it to anything you did. This logs a reading every few seconds, aggregates it, and shows consumption by hour and day against outside temperature. It's for me and my household, and I've given the setup notes to four friends who built their own. It doesn't do anything clever like appliance disaggregation — it just shows you when the electricity went.
- What I owned
Everything, though it's small: the Python collector that reads the pulse sensor, the aggregation into daily and hourly rollups, the storage schedule, and the Grafana dashboards. I also did the physical install, which involved more electrical-tape improvisation than I'd like to admit and one sensor mounted with the wrong side facing the meter for the first week. I wrote the setup notes when the third person asked for them.
- Technical & product decisions
I decided to store raw pulse counts and derive everything from them, rather than storing computed kilowatt-hours, because I got the pulse-to-kWh constant wrong initially and would have lost two weeks of data if I'd baked it in. Recomputing from raw counts is a query change. I put it on MQTT rather than writing directly to the database so that adding the temperature sensor later was a new publisher rather than a change to the collector, which paid off immediately when I added a second sensor for the water heater circuit. I run it entirely on the local network with no cloud component, which is partly privacy and mostly that I didn't want a hobby project to have an uptime obligation.
- Hardest challenge
The hardest problem was drift. The pulse sensor occasionally misses a pulse or double-counts one, and over a month those errors accumulate into a meaningful difference from the meter's own reading. I fixed it by entering the meter's physical reading manually each month and using it to correct the accumulated total, distributing the correction proportionally across the period rather than dumping it on one day. It's inelegant and it works — my monthly total is now within about one percent of the bill, against six or seven percent before.
- Result & impact
The original bill turned out to be real: an old chest freezer in the utility area was running almost continuously with a failing seal, and it showed up as a flat overnight floor that shouldn't have been there. Replacing it cut our baseline by roughly a fifth. Since then the data has settled two more household arguments and mostly just sits there being interesting. Four friends run a version of it, and one of them found a similar problem with a pool pump.
- Who else worked on it
An electrician friend checked the install before I left it running unattended, and told me the first mounting was going to fall off within a month, which it would have. One of the four friends who built their own version wrote a much clearer set of setup notes than mine and I replaced mine with his. My partner is the one who insisted the dashboard show cost in pesos rather than kilowatt-hours, which is obvious in hindsight and is why anyone else in the house looks at it.